Tuesday, February 24, 2009

Part 7: Oil Prices - what really happened?

I’m offering one explanation for the recent variation in oil prices and the current economic collapse. It is certainly not the only theory. As for oil prices, it has been suggested that speculators drove up oil prices and then couldn’t maintain the momentum. Sub-prime mortgages and their impact on the banking and financial sectors are most often blamed for the economic melt-down. Perhaps there is no way to absolutely determine the underlying causes for these events.

Nevertheless, the Energy Information Administration of the US Department of Energy has compiled some very intriguing data. The attached chart shows world-wide consumption and production of oil over the period from 2003 to 2010. The data was derived from the EIA World Oil Balance spreadsheet found here:

http://www.eia.doe.gov/oil_gas/petroleum/info_glance/petroleum.html

The chart clearly shows that oil production exceeded consumption for 2004 and 2005. During this period, oil prices ranged from $30 to $60 per barrel. In 2006 demand continued to increase but production could not keep pace. Demand continued to exceed supply for all of 2007 and most of 2008. During this time the strategic reserves were depleted, and just like all good economists would predict, the price of oil skyrocketed from about $50/bbl in Sept. 2006 to almost $150/bbl in July 2008.

We might make a few more observations from this chart. First, in spite of record oil prices over a 3 year period, world-wide production rates never exceeded 86 million barrels per day while consumption reached nearly 87 million. Second, the major collapse in oil price occurred when demand plunged from about 86.5 million barrels/day in Q1 2008 to less than 85 million barrels/day in Q3. Most of this drastic decline occurred in the US. (It is interesting to note that China’s consumption actually increased in the same period!)

Once supply (production) exceeded demand (consumption) the price plummeted.

And we all know how this collapse in consumption has been reflected in the stock market.

One last observation can be made - and it is probably the most important. The EIA forecasts indicate that demand for oil will increase steadily from Q2 2008 until 2010. This prediction is based on an assumption that the recession will end and the economy will begin to grow. Oil production is expected to drop in 2009, and this should stabilize oil prices in the near term. However, the most interesting part is that oil production is somehow expected to reach almost 87 million barrels/day to accommodate the anticipated growth in consumption that comes with the end of the recession.

Where will this additional production come from?

Most of the remaining reserves are from ultra deep water fields, remote areas, or from non-conventional sources (like the tar sands). These projects are being shelved in the current price environment.

If the economy continues to grow, along with it’s associated increase in oil consumption, what will prevent another spike in the price of oil when this expected production increase doesn’t occur?

Part 6: Oil Prices - the Big Crash

Surprizingly, in my presentation to the CSEG I felt the urge to remind everyone - including myself - that there was no guarantee that oil prices would not decrease in the near future. While most of the evidence suggests that it will be very difficult to increase world-wide production levels very far beyond 86 million barrels/day, it is certainly possible to drastically decrease consumption. This is exactly what happened in September 2008.

Every sector of the economy consumes energy to create and transport goods. The transportation sector alone accounts for something near 70% of US oil consumption and 55% on a world-wide basis. When the price of oil became too high, people responded by selling SUVs and buying hybrids, driving less, taking public transit or car pooling. More drastic effects occurred when new car sales plummeted, which resulted in factory closures which resulted in massive lay-offs which resulted in a huge reduction in commuter miles because those factory workers were no longer driving to work. Then truckers were laid off because parts were no longer being hauled to the factories and new cars were no longer being shipped to a nation-wide dealer network. Laid-off workers bought fewer goods and services and this resulted in bigger reductions in the freight hauling industry. All of these actions decreased demand and freed-up capacity in the energy supply chain.

All of us had a front row seat to these events. It certainly had a big impact for our family. In August, as we made our way to Georgia we had to pay over $4.00/gallon for diesel fuel. You can bet that got expensive pulling our trailer! By mid-September we were actually seeing fuel shortages in SouthEast Georgia and several gas stations could not obtain fuel.

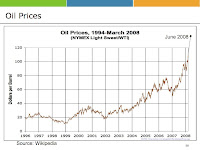
Then things shifted in a big way. News of factory closures and layoffs were an everyday occurrence. The price of oil started to slide - then plummet - as illustrated so well in this graph from wiki. If you have the time, the related article is certainly worth a read:

http://en.wikipedia.org/wiki/Oil_price_increases_of_2004-2006

Diesel was about $2.40/gallon as we made our trip back to Canada in December.

Part 5: Oil Prices - the Big Climb

Oil prices had reached an historic high when I made my last presentation to the CSEG in June, 2008. I wanted to include a slide that would illustrate this incredible rise in the price of a barrel of oil and the best example I could find only went up to March of 2008.

As you can see, the June price of $135/barrel was already well beyond the axis of the graph. Several forecasters projected that the price would be between $150/bbl and $250/bbl within the coming year. Anything seemed possible as the price continued to climb towards a peak of $147.27 on July 11.

This was clearly the result of an ever-growing demand for a limited resource.

So - what happened after that?

Saturday, February 14, 2009

Part 4: Economy vs. Reality

Economies are expected to grow on an annual basis. Economic growth is required because the world’s population continues to increase and every new person needs food, housing, transportation, health care, education, transportation, entertainment, consumer goods and an occupation. Lack of economic growth results in unemployment, disease, poverty and despair. At least this is what the economists and politicians tell us. For now, let’s assume that it’s true.

We have already seen how energy consumption is directly correlated with economic growth. This relationship exists because manufacturing, agriculture, transportation, resource extraction and even service industries all consume energy for their operation. If the amount of energy consumed for a given product - let’s take a new house for example - is constant, then increasing the number of houses constructed in a given year by 10% will increase the associated energy expenditure by the same percentage.

Let’s summarize:
Economies need to grow. Economic growth is powered through increasing energy consumption. In our industrialized societies, continually increasing energy consumption requires an virtually unlimited supply of fossil fuels.

What happens to economic growth when the available fossil fuel supply can no longer meet the increasing demands?

This same question was asked in graphical form by the people at TheOilDrum.com. Their attached graph shows the historic increase in world-wide oil consumption from 1983 to 2005. Several forecasts are provided for daily oil production rates from 2005 to 2030. The first projection, shown in purple, reflects the view of the US International Energy Administration. They based this forecast on a known relationship between economic growth and oil consumption. Economists had predicted that the world economy will continue to grow in a linear fashion. Oil consumption must therefore increase in the same linear manner. If oil consumption increases then oil production rates will inevitably increase at the same rate to meet the demand. Nothing difficult about this - Except.....

The other forecasts of predicted oil production rates were created by a thorough analysis of geology, reserve estimates and known rates of production decline in various basins. While there is some variation in the assumptions and some uncertainty in the data, it is clear that these three independent forecasts predict that oil production will peak somewhere between 2005 and 2011. Once peak production is achieved, production rates will decline.

What does this mean for economic growth?

Current economic projections for the year 2015 will require daily oil production rates of 100 million barrels of oil per day. Realistic forecasts estimate that actual production rates will be somewhere between 65 and 80 million barrels/day. These production rates are significantly lower than the 85 million barrels produced in 2005.

How can the world-wide economy - at least as measured with current metrics - possibly continue to grow?

I suspect that our choices look like this:

a) We will see a massive reduction in food supply, employment, housing, and manufacturing.
b) We will get a lot more efficient in the way we use energy to power our standard of living.
c) All of the above.

One thing is for sure. The status quo is not an option.

Part 3: Peak Oil

M. King Hubbert (1903 - 1989) was a geoscientist who worked for Shell Oil in the Houston research lab - as well as the United States Geological Survey, Stanford University and UC Berkeley. During his career Hubbert made many notable contributions to the fields of petroleum geology, geophysics and engineering. Notwithstanding these accomplishments, King Hubbert is most widely known for his 1956 paper entitled “Nuclear Energy and Fossil Fuels”. In this ground-breaking paper, Hubbert predicted that oil production in the continental United States would peak (achieve a maximum rate) between the late 1960s and early 1970s. After peak production was achieved, daily production rates would slowly decline roughly following a bell-shaped curve. His prediction was widely criticized - until the domestic US production peaked in 1971 at a rate of 10.2 million barrels per day. Domestic US production rates have been in gradual decline ever since. In 1974, Hubbert predicted that world-wide production rates would peak somewhere around 1995.

Hubbert based his predictions on the observation that the amount of oil in any geographic region - ranging from a single field to the entire planet - is finite. He further reasoned that the rate of field discovery would initially increase quickly and then decline as all the possible accumulations were found. Oil extraction would logically follow the same trend as the discoveries, with a time lag. In the domestic US this lag was about 35 yrs. Once production starts in a region the production rate increases exponentially, as more efficient facilities are installed, until the peak production rate is achieved and then the production rate begins to decline.

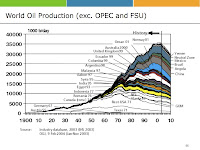
Hubbert’s predictions are clearly confirmed when we examine historic production rates on a world-wide basis. From 1900 to 1960 we can see the exponential growth of US oil production that fueled America’s industrialization. As US production rates began to peak, other basins were discovered and brought onto production. One by one, each of these basins have seen the pattern of exponential production increase, peaking and decline. Production peaks have now occurred in the US (1971), Canada (74), Malaysia (97), Ecuador (99), UK (99), Australia (2000) and Norway (01). As we can see the exponential growth in production rates for all of these countries combined (and more), ended somewhere around 1995. Peak production rate appears to be somewhere in the region of 36 million of barrels/day.

It is important to note that these production figures exclude OPEC and the Former Soviet Union. OPEC - especially Saudi Arabia - controls most of the world’s oil anyway. Therefore, it would be negligent not to mention that OPEC production rates hit a maximum of about 35 million barrels/day in 2005 - and in spite of record prices - began a slow decline through 06 and 07. Current projections for OPEC from 2008 to 2010 are 35.75, 35.04 and 36.61 Mbbls/day. FSU projections for the same period are 12.53, 12.57 and 12.78 Mbbls/day. This gives world-wide projections for the coming years of 85.46 (2008), 84.93 (2009) and 86.59 (2010).

Please note: These estimates were made before the announcement of several project cancellations due to the recent crash in oil prices.

Friday, February 13, 2009

Part 2: Energy Consumption as a Function of Economic Growth

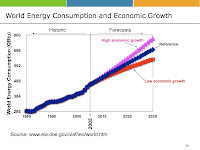
The direct link between economic growth and energy consumption is nicely illustrated on this 2005 graph created by the Energy Information Administration of the US Department of Energy. From 1980 to 2005 the graph shows a single line which represents the historic increase in energy consumption over this time period. From 2005 to 2030, three different projections are provided. The reference scenario assumes that the global economy will continue to grow at roughly the same rate as it has for the past 25 years. If the economy were to grow more rapidly, the forecast indicates that this would correspond a more rapid growth in energy consumption. Lower economic growth would result in a slower increase in energy demand.

This strong correlation between economic growth and energy consumption isn’t unexpected. Economic growth is commonly defined as the increase in the amount of goods and services produced by an economy over time. In our industrialized world, the creation, transportation and consumption of these “goods and services” are completely dependent on a unrestricted source of cheap and available energy.

It might be helpful to give an example. Let’s look at automobiles. There is a chain of events that occurs for every car that is produced and every step in that chain consumes a certain amount of energy. These steps range from the mining, extraction and refining of iron ore, manufacturing steel, transporting materials to factories, forging parts, molding the plastic components, powering the factory assembly lines, transporting workers from their homes to the factories and transporting the finished cars to the dealerships. Each car that is produced represents an accumulated expenditure of energy. The more cars that are produced, the larger the energy expenditure. This same type of illustration can be made for the resource extraction, agriculture, construction, transportation, housing, communication and tech sector.

Oil Supply and the Economy (Part 1 - Demand Forecasts)

In June 2008, I made a presentation to the Canadian Society of Exploration Geophysicists in Calgary. If you want to hear the talk - it is available on the link shown below.

(Warning - Perhaps this is something best considered for a night when you are having trouble falling asleep!)

The most important part of the talk is near the end, and it goes something like this:

World-wide energy demand has increased steadily every year since the beginning of the industrial age and forecasts indicate that this growth in energy demand will continue at the nearly same rate until at least 2030. This projected increase in energy consumption is based on economist’s assumptions of steady growth in the world-wide economy.

(Link to presentation for those brave souls who might be interested: http://cseg.ca/events/luncheons/2008/06jun/20080616-Hirsche.cfm )